

Analysis timestamp: July 28, 2026, 11:15 a.m. WIB (04:15 UTC). Timeframe: daily and short-term swing analysis, using official Nasdaq index data available through the July 27 U.S. session. NAS100 is commonly used by brokers as a trading label for exposure linked to the Nasdaq-100, but broker CFD and futures quotations can differ from the official cash index. For that reason, the levels below are reference zones rather than exact prices that must match every platform.
The Nasdaq-100 ended July 27 at 28,039.21, after trading between 27,786.54 and 28,460.20. The 673.66-point intraday range shows that price discovery is already sensitive ahead of a concentrated sequence of Federal Reserve, inflation, growth and large-cap earnings events. The close remained above the session low but below the midpoint of the day’s range, leaving neither side with a decisive technical confirmation.
Recent price context
The broader trend entering late July has been supported by a powerful second-quarter recovery. Nasdaq’s June 30 fact sheet recorded a 27.53% price return for the Nasdaq-100 in the second quarter and a 19.91% year-to-date return at that date. Nasdaq’s July commentary attributed the rebound partly to continued investor focus on artificial intelligence and strong semiconductor performance. That background supports the longer-term bullish case, but it also raises the risk that expectations are elevated and that disappointing earnings guidance could produce a larger reaction.
Concentration matters. Nasdaq’s fact sheet showed technology at 68.51% of index weight on June 30, with NVIDIA, Apple, Micron, Microsoft and AMD among the largest constituents. A market-cap-weighted index can therefore move sharply when a small group of dominant companies changes direction. For beginner and intermediate traders, this means NAS100 should not be treated as a simple reading of the entire U.S. economy; it is especially sensitive to growth expectations, AI spending, semiconductor demand and the discount rate applied to long-duration earnings.
Technical levels to monitor
Immediate pivot zone: 28,000 to 28,039. The official July 27 close at 28,039.21 places the index directly around the psychologically important 28,000 area. Holding above this zone would suggest that buyers are still defending the latest closing reference. Repeated failure to remain above it would keep the short-term structure vulnerable.
First support: 27,786 to 27,800. This zone is based on the verified July 27 session low of 27,786.54. A daily close below it would indicate that the market has accepted prices beneath the latest intraday floor, increasing the probability of a deeper retracement. Because no current moving-average or momentum-indicator values were independently verified for this article, the analysis does not attach an unverified secondary support target below that level.
First resistance: 28,460 to 28,500. The verified session high was 28,460.20. The nearby 28,500 level is included only as a round-number reference, not as a separately confirmed historical barrier. A sustained daily close above the verified high would be stronger evidence that the index has absorbed near-term selling pressure than a brief intraday spike above it.
The large distance between support and resistance means traders may see false breaks around major announcements. A move beyond either boundary that quickly returns inside the 27,786 to 28,460 range would show rejection rather than confirmation. Closing behavior is therefore more informative than a single short-lived price print.
Fundamental drivers behind the levels
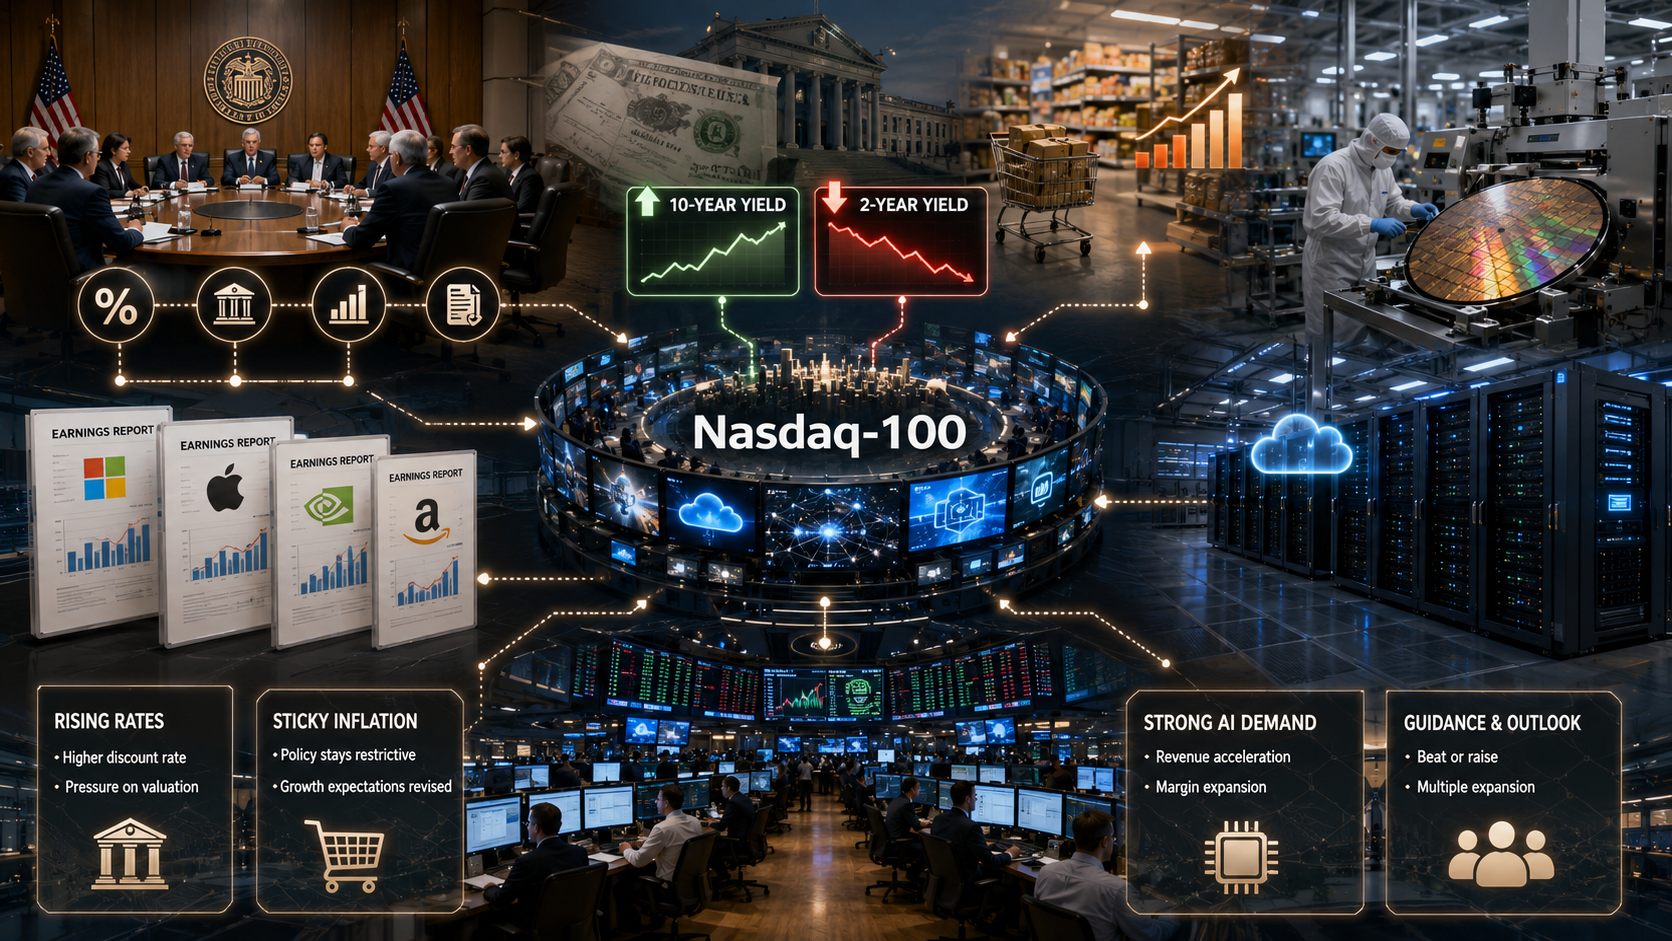
The Federal Reserve is holding a two-day meeting on July 28 and 29. At its June meeting, the FOMC maintained the federal funds target range at 3.50% to 3.75%, while stating that inflation remained elevated relative to its 2% goal. For a growth-heavy index, the key issue is not only whether rates change, but also how policymakers describe inflation, economic activity and the path of future policy. A more restrictive message can raise discount rates and pressure high-valuation shares; a less restrictive message can support them, although the reaction will depend on what markets had already priced in.
The next day brings another unusually dense risk window. The U.S. Bureau of Economic Analysis is scheduled to publish the advance estimate of second-quarter GDP and June personal income and outlays on July 30 at 8:30 a.m. ET. The May PCE price index was 4.1% higher than a year earlier, while core PCE rose 0.3% from the previous month. The July 30 release could therefore materially change expectations for interest rates. The Bureau of Labor Statistics also lists the Employment Cost Index for July 31 and the July Employment Situation for August 7.
Corporate events are equally important because several heavyweight constituents report in the same period. Microsoft and Meta are scheduled to release results after the market close on July 29. Apple and Amazon have scheduled their earnings calls for July 30. Their guidance on cloud demand, AI investment, advertising, consumer spending, margins and capital expenditure may affect the index even when the macro data are broadly in line with expectations.

Conditional scenarios
Bullish scenario
A bullish continuation would gain credibility if NAS100 first holds the 28,000 to 28,039 pivot and then records a sustained close above 28,460.20. Fundamental confirmation could come from a Federal Reserve message that does not intensify rate concerns, inflation data that avoid a meaningful upside surprise, and large-cap earnings guidance that supports continued AI and cloud investment. The bullish interpretation would be weakened if price breaks above resistance but rapidly returns below 28,039, and it would be invalidated in the near-term framework by acceptance below 27,786.54.
Bearish scenario
A bearish scenario would strengthen if price closes below 27,786.54 and subsequent rebounds fail beneath the 28,000 to 28,039 pivot. Possible catalysts include a more restrictive policy signal, stronger inflation pressure, rising Treasury yields, weaker technology guidance or concern that AI-related capital spending is not producing returns quickly enough. This bearish interpretation would lose credibility if the index recovers the pivot and would be invalidated by a sustained close above 28,460.20.
Range scenario
The index may also remain trapped between 27,786 and 28,460 while markets process conflicting signals. This would be consistent with strong structural enthusiasm for technology offset by uncertainty over inflation, policy and earnings expectations. Inside that range, short-term direction may change quickly and technical signals are less reliable.
Risk context and limitations
Event risk is unusually concentrated, so gaps and rapid reversals are possible. Official cash-index values, Nasdaq futures and broker NAS100 CFDs may show different session hours, financing adjustments and quote construction. Readers should compare the reference levels with the instrument specifications on their own platform. The analysis deliberately avoids unverified live prices, moving averages, RSI readings and chart patterns. It is informational market analysis, not financial advice, a trading signal, a personalized recommendation or a promise of returns.